Inflation & Purchasing-Power Monitor
Headline inflation is one number. Household budgets are not. This monitor separates the official U.S. CPI reading from the spending groups underneath it, then shows how price changes can alter purchasing power and why a household's own spending mix may feel different from the headline.
United States data · BLS CPI-U · Personal-basket illustration runs locally in your browserOne inflation rate does not describe every part of a household budget
The BLS CPI is built from a broad market basket. In September 2026, transportation prices were 7.9% above a year earlier while medical care was 1.5% higher. Housing, the largest major group by relative importance, was up 3.3%.
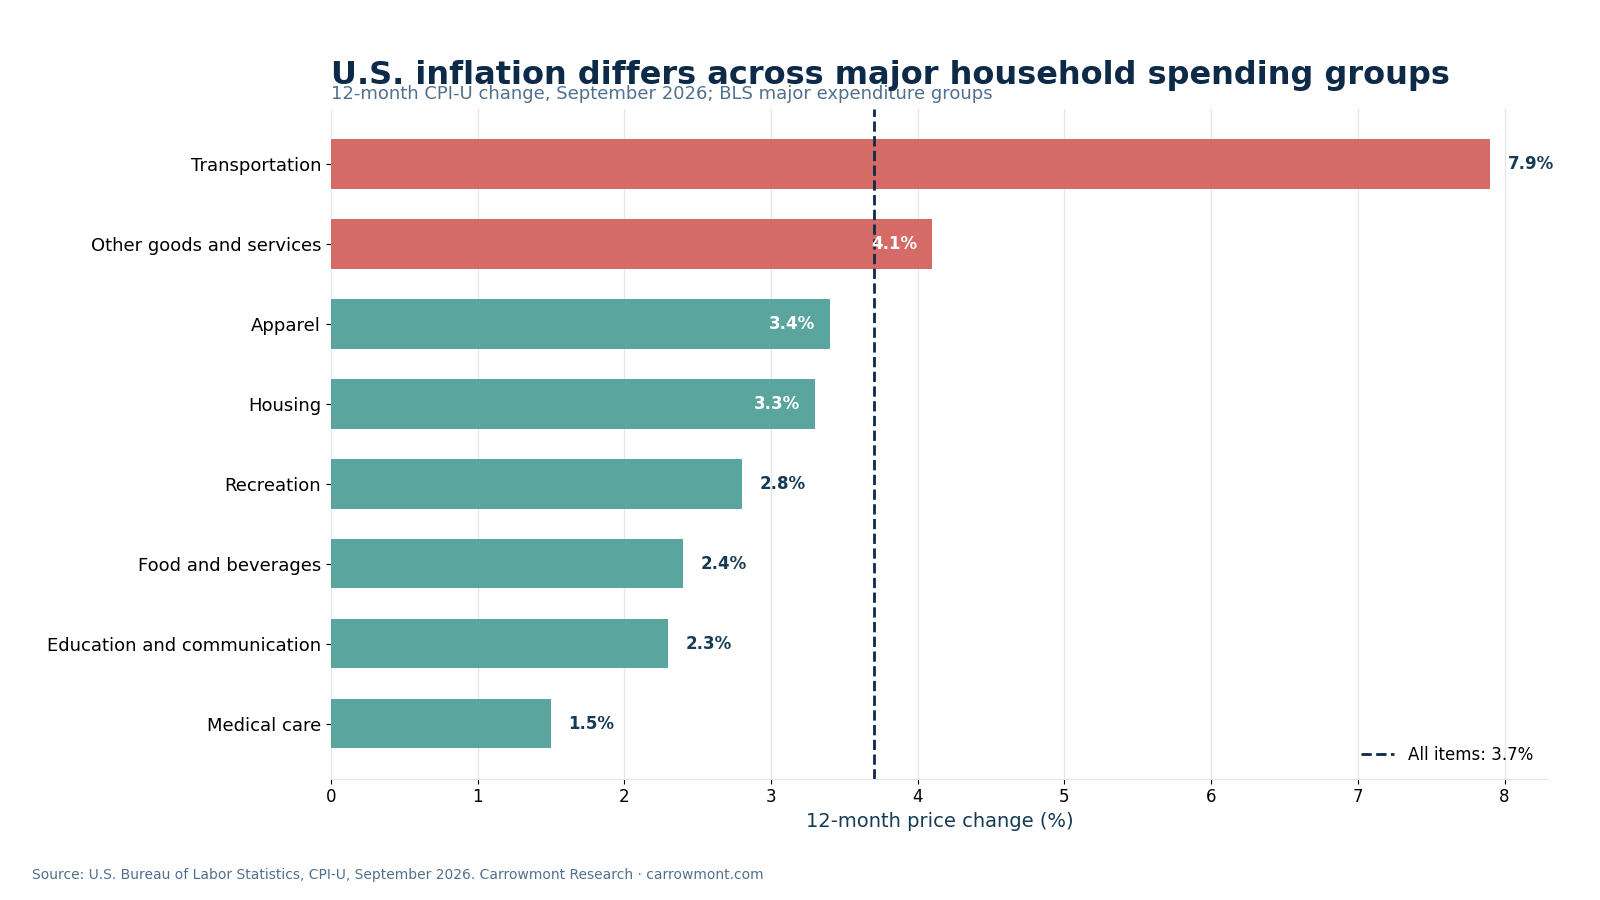
| Major expenditure group | BLS relative importance | 12-month change |
|---|---|---|
| Food and beverages | 14.330% | 2.4% |
| Housing | 44.140% | 3.3% |
| Apparel | 2.445% | 3.4% |
| Transportation | 17.086% | 7.9% |
| Medical care | 8.230% | 1.5% |
| Recreation | 5.063% | 2.8% |
| Education and communication | 5.807% | 2.3% |
| Other goods and services | 2.900% | 4.1% |
Estimate the inflation implied by your own spending mix
This local illustration applies the current 12-month BLS price change for each major expenditure group to the shares you enter. It is designed to answer a narrow question: if your household spends more or less than the BLS basket in categories moving at different rates, how different might the weighted result look?
| Spending group | Current BLS change | Your share |
|---|---|---|
| Food and beverages | 2.4% | % |
| Housing | 3.3% | % |
| Apparel | 3.4% | % |
| Transportation | 7.9% | % |
| Medical care | 1.5% | % |
| Recreation | 2.8% | % |
| Education and communication | 2.3% | % |
| Other goods and services | 4.1% | % |
Purchasing power compounds over longer periods
The latest annual inflation rate is useful for current conditions, but purchasing power is a cumulative question. The CPI-U all-items index rose from 241.428 in September 2016 to 336.940 in September 2026. On that index comparison, the amount needed in September 2026 to match $100 of September 2016 purchasing power is about $139.56.
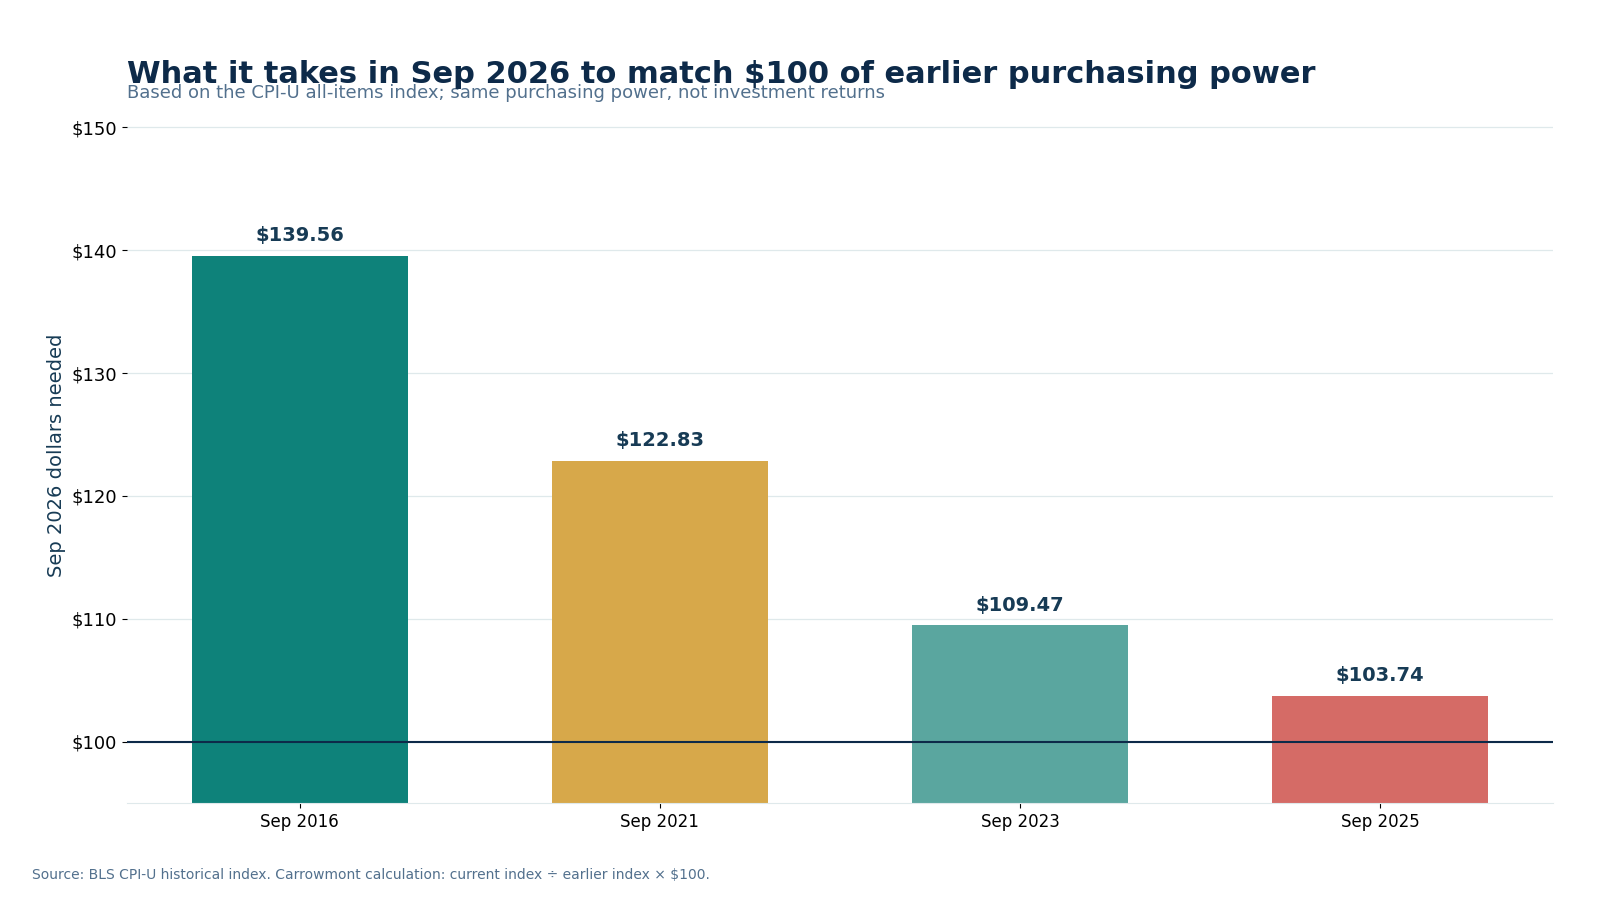
| Earlier reference | CPI-U index | Price-level increase to Sep 2026 | Sep 2026 dollars needed to match $100 then | $100 in Sep 2026 expressed in then-dollars |
|---|---|---|---|---|
| Sep 2016 | 241.428 | 39.56% | $139.56 | $71.65 |
| Sep 2021 | 274.310 | 22.83% | $122.83 | $81.41 |
| Sep 2023 | 307.789 | 9.47% | $109.47 | $91.35 |
| Sep 2025 | 324.800 | 3.74% | $103.74 | $96.40 |
| Sep 2026 | 336.940 | 0.00% | $100.00 | $100.00 |
Selected pressure points show why the headline can feel incomplete
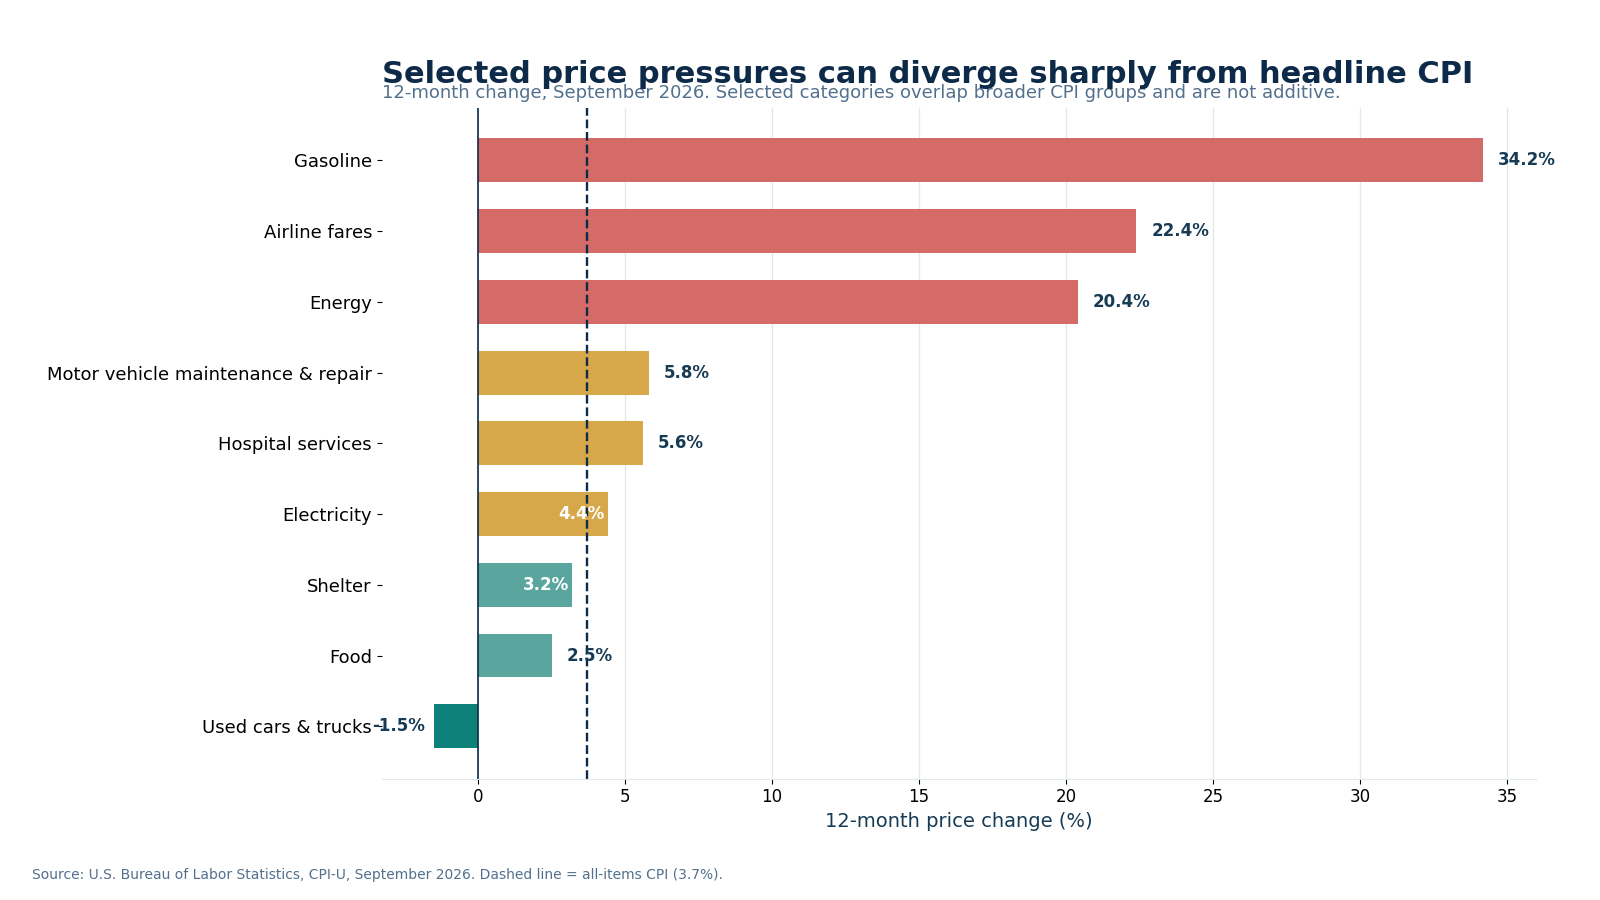
Some categories sit far above or below the 3.7% headline. Energy was 20.4% higher than a year earlier, gasoline 34.2% higher and airline fares 22.4% higher, while used cars and trucks were 1.5% lower. These are selected overlapping categories, not pieces that should be added together.
Use the finding in your own plan
The Research monitor describes the current U.S. inflation environment. Carrowmont's tools let you separate that evidence from your own planning assumptions instead of silently treating today's CPI as a forecast.
Related reading: Inflation and purchasing power · How oil prices can affect inflation · Inflation and retirement planning.
Methodology and sources
Official BLS values and Carrowmont calculations are kept separate. The personal-basket widget runs entirely in the browser and does not transmit or store the spending shares you enter.
- U.S. Bureau of Labor Statistics, Consumer Price Index — September 2026 — current CPI-U, core CPI, major expenditure-group relative importance and 12-month price changes.
- BLS Consumer Price Index home — release summary and next-release schedule.
- BLS CPI-U historical table, U.S. city average — September index anchors used in the purchasing-power calculations.
Citation and media note
For corrections, data questions or media/business enquiries, use the Carrowmont contact page.