Mortgage Affordability Monitor
How much does today's mortgage-rate environment change the monthly payment on the same loan, and how does that compare with recent new-home prices and household income?
United States data · USD · 30-year fixed-rate illustrationWhat a one-percentage-point rate move changes
A one-point mortgage-rate move changes the payment even when the loan balance is identical. The chart keeps the loan at $400,000 and the term at 30 years so the rate effect stays visible.

| Loan balance | 6.32% | 7.32% current | 8.32% |
|---|---|---|---|
| $200,000 | $1,241 | $1,374 | $1,512 |
| $300,000 | $1,861 | $2,061 | $2,269 |
| $400,000 | $2,481 | $2,748 | $3,025 |
| $500,000 | $3,101 | $3,435 | $3,781 |
| $750,000 | $4,652 | $5,152 | $5,671 |
The rate moved more than the home-price reference
The current 30-year fixed PMMS reference is 1.13 percentage points above the comparable Freddie Mac observation from 23 October 2025. Separately, Census/HUD reports the August 2026 median new-house sale price at $393,700; its current release shows that figure below the revised August 2025 comparison. The two series measure different things, but together they show why purchase-price changes alone do not describe financing affordability.
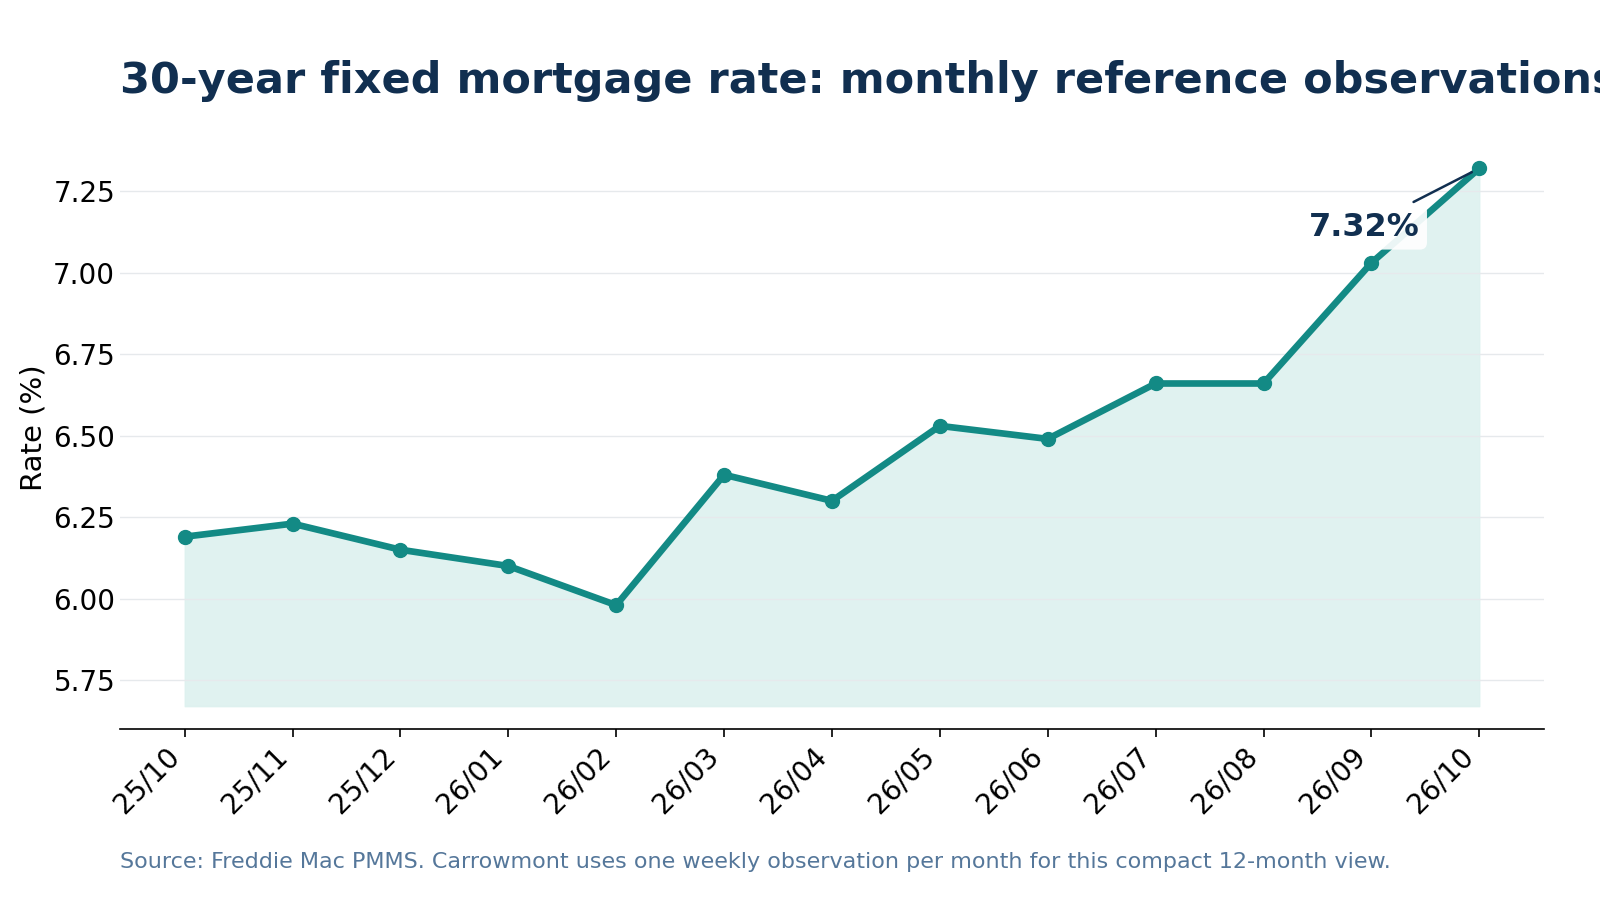
Rate data table
| PMMS date | 30-year fixed rate |
|---|---|
| 2025-10-23 | 6.19% |
| 2025-11-26 | 6.23% |
| 2025-12-31 | 6.15% |
| 2026-01-29 | 6.10% |
| 2026-02-26 | 5.98% |
| 2026-03-26 | 6.38% |
| 2026-04-30 | 6.30% |
| 2026-05-28 | 6.53% |
| 2026-06-25 | 6.49% |
| 2026-07-30 | 6.66% |
| 2026-08-27 | 6.66% |
| 2026-09-24 | 7.03% |
| 2026-10-22 | 7.32% |
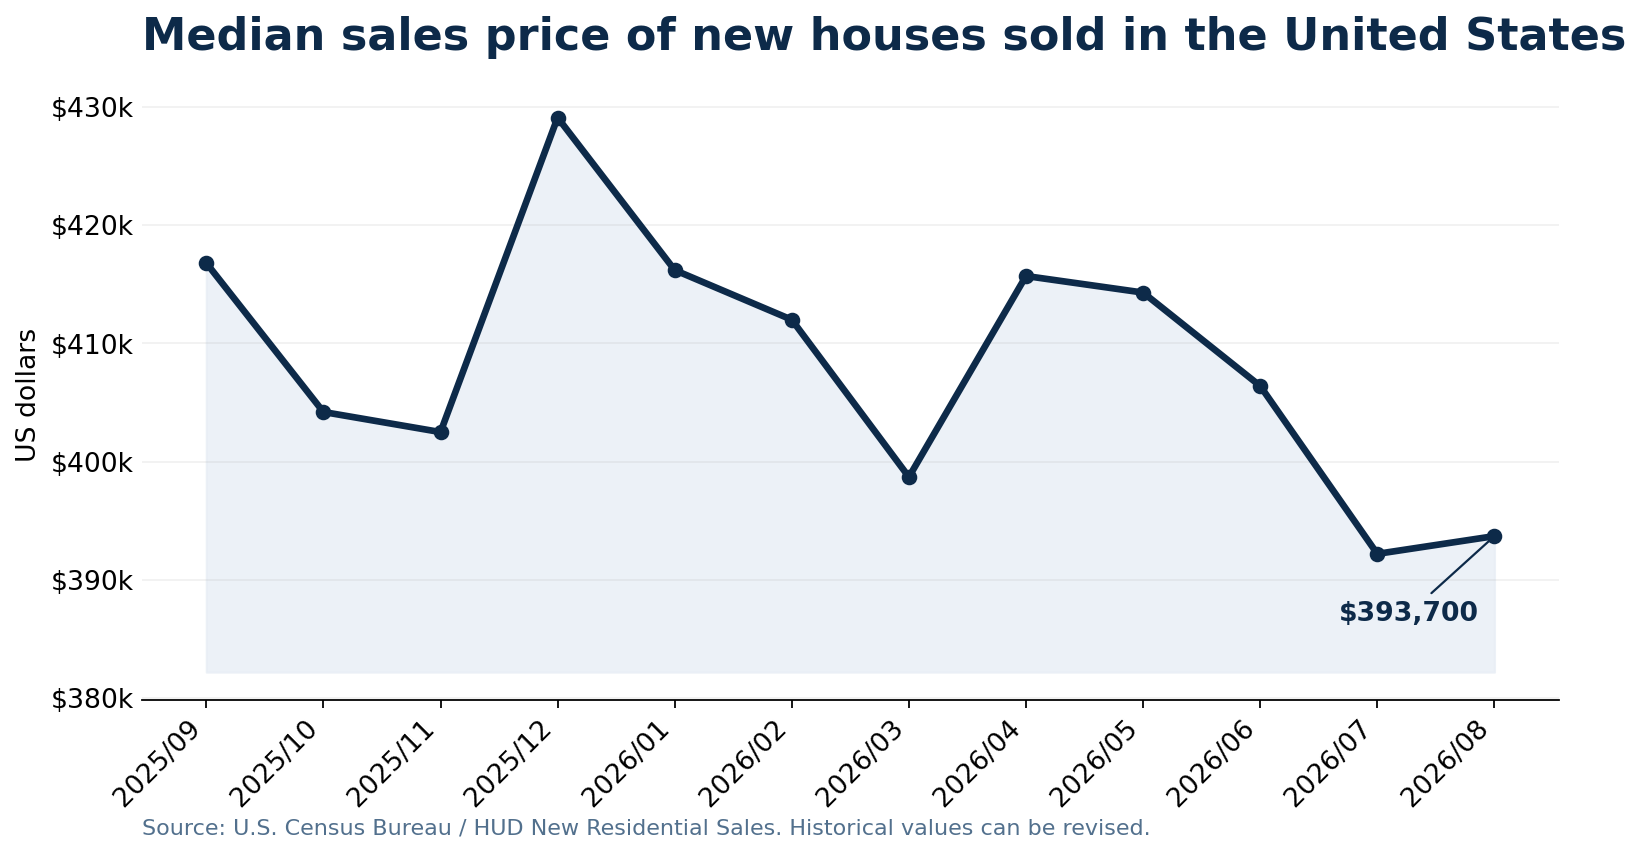
Home-price data table
| Period | Median new-home price |
|---|---|
| 2025-09 | $416,800 |
| 2025-10 | $404,200 |
| 2025-11 | $402,500 |
| 2025-12 | $429,100 |
| 2026-01 | $416,200 |
| 2026-02 | $412,000 |
| 2026-03 | $398,700 |
| 2026-04 | $415,700 |
| 2026-05 | $414,300 |
| 2026-06 | $406,400 |
| 2026-07 | $392,200 |
| 2026-08 | $393,700 |
Median-new-home reference scenario
Using the latest $393,700 median new-house sale price, a standardized 20% down payment leaves a $314,960 mortgage. At 7.32% over 30 years, principal and interest are about $2,164 per month.
Against the Census 2025 median household income of $87,460, that P&I-only payment is about 29.7% of gross median monthly household income.
Use the finding in your own plan
The Research monitor keeps the scenario standardized. The Home Affordability Calculator is where you can add your own household cash flow, deposit, rate, term and recurring ownership costs.
Methodology and sources
The payment calculation uses the standard fully amortizing fixed-payment formula over 360 monthly payments. Official reported data and Carrowmont calculations are kept separate.
- Freddie Mac Primary Mortgage Market Survey (PMMS) — 30-year fixed-rate reference; current observation 22 Oct 2026.
- U.S. Census Bureau / HUD New Residential Sales — median sales price of new houses; latest available period Aug 2026.
- U.S. Census Bureau, Income in the United States: 2025 — median household income.
- FRED series MSPNHSUS — convenient access to the revised Census/HUD monthly home-price series used for the trend table.
Citation and media note
For corrections, data questions or media/business enquiries, use the Carrowmont contact page.